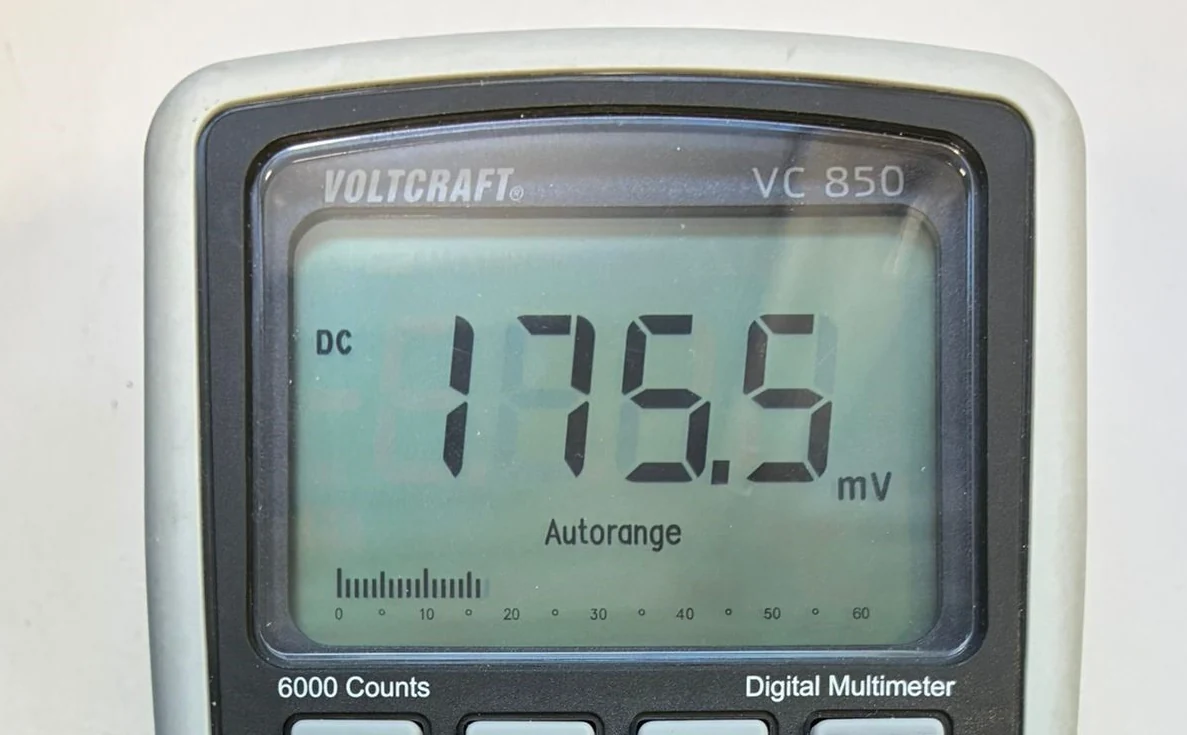
 Voltage
VALUE SHOWN175.5 mV
Handheld multimeter
Capture digital readings without connecting the instrument to a PC.
OFF THE DISPLAY. STRAIGHT INTO YOUR WORKFLOW.
Your instrument has no PC interface?
A good webcam is enough.
Displayreader captures the values shown automatically.
Compatible with Excel and MET/CAL.
The instruments you already own. New possibilities.
01 / A SIMPLE START
No expensive special camera is required. A good, modern, off-the-shelf webcam is enough to capture the values on your display.
Mount the webcam on a tripod. That makes it easy to align and keeps it steady in position throughout the measurement.
02 / FROM A SINGLE VALUE TO A FULL SERIES
Read your instrument over hours or days and build complete measurement series with time stamps. The values can be shown as a chart and exported to Excel or other formats for further analysis.
Point a good webcam on a tripod at the display. The reading stays clearly visible in the image.
Displayreader reads the values automatically – individually, as a series or over longer periods.
Analyse the results, create charts or transfer values into MET/CAL.
ORIGINAL DISPLAY PHOTOA visible reading becomes a measured value you can work with.
| Time stamp | Value | Unit |
|---|---|---|
| 10:00:09 | 175.6 | mV |
| 10:00:10 | 175.4 | mV |
| 10:00:11 | 175.5 | mV |
03 / BUILT FOR DEPENDABLE VALUES
Used correctly and under optimal conditions, test series carried out reached 100,000 readings without a single error – a recognition rate of 100 % in those tests.
This requires a clean, clearly legible display, a sharp camera image and no disruptive effects such as reflections or obscured digits.
correctly recognised values
under optimal test conditions
04 / LESS MANUAL WORK
Reading every value and typing it in by hand costs time and can introduce transcription errors. Gapless measurement series over long periods are hardly practical this way.
Displayreader takes over that routine automatically – over longer periods too. Used correctly and under optimal conditions, 100 % of the values were captured correctly in the test series.
05 / EXPERIENCE FROM LABORATORY PRACTICE
STOTZ-Software has been developing automation solutions and databases for laboratories since 2001. That knowledge of measurement procedures, calibration and data processing went into Displayreader too.
STOTZ-Software Software for laboratories since 2001Automation. Databases. Laboratory practice.
06 / YOUR DATA STAYS WITH YOU
Displayreader can run entirely locally in your laboratory. Capture and processing happen on your own computer; your measurement data stays with you.
Local operation needs neither a network connection nor an internet connection nor any communication to the outside. Integration into your internal network is possible if required.
Local capture · local data
07 / REAL DISPLAYS FROM PRACTICE
Instruments look different – and so do their displays.
DisplayReader is not limited to one particular instrument or a single display layout.
A wide range of digital readings can be processed.
Voltage
Capture digital readings without connecting the instrument to a PC.
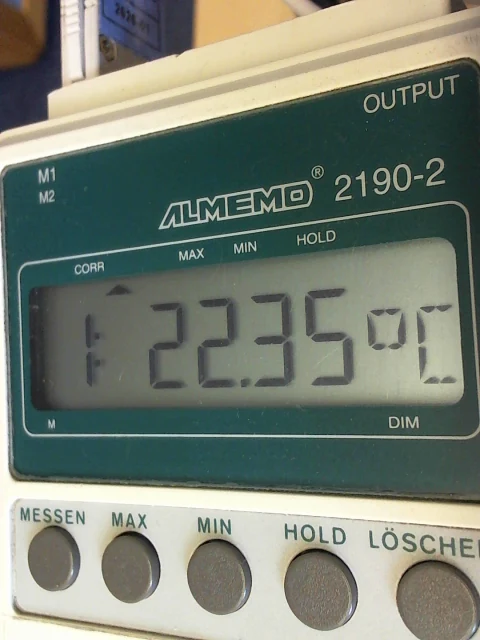 Temperature
Document temperature curves and make changes visible.
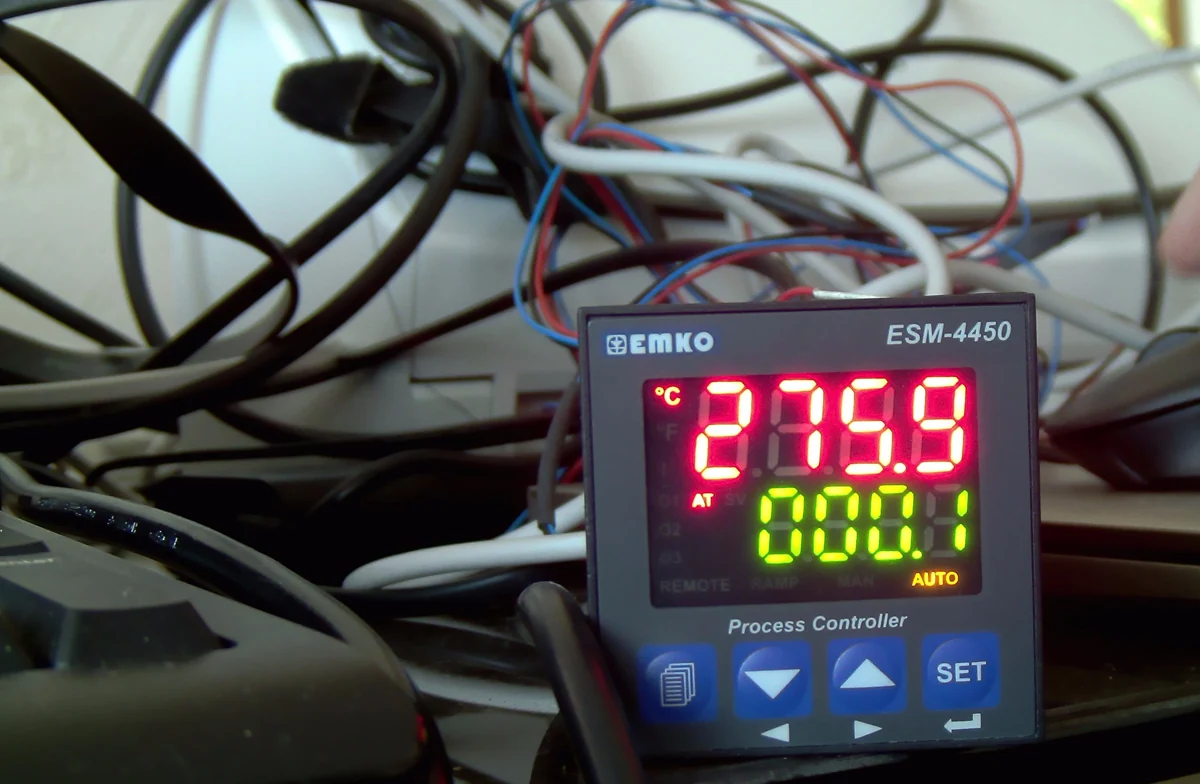 Process
Include existing devices with illuminated digit displays as well.
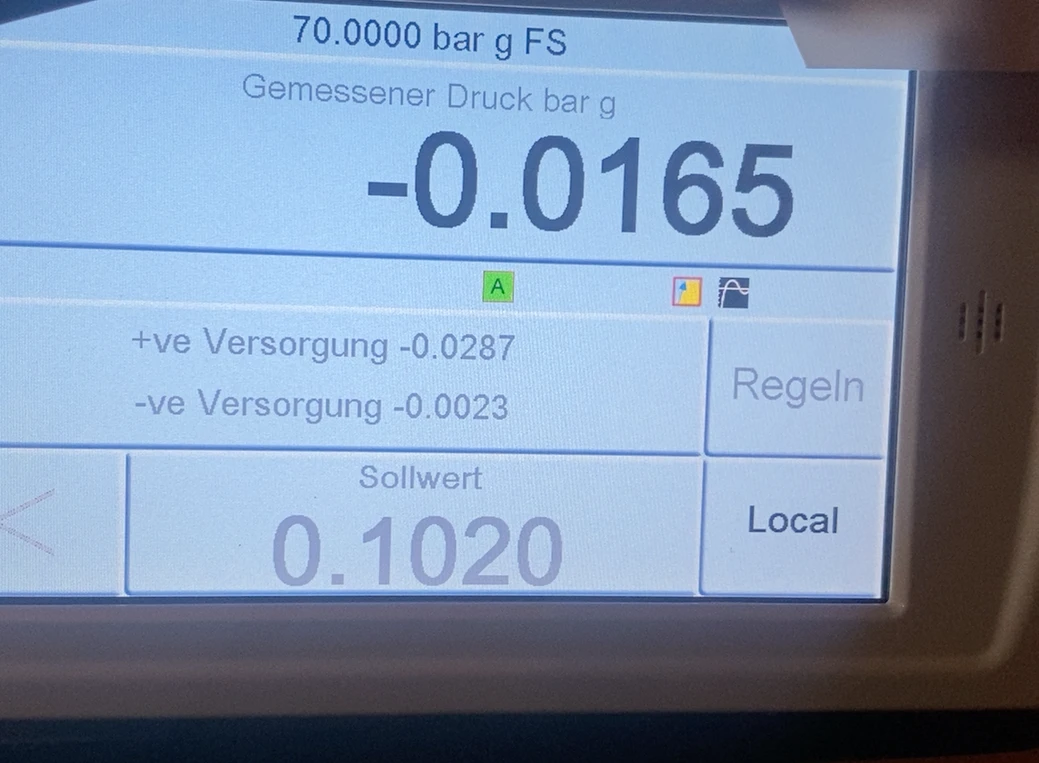 Pressure
Capture pressure values optically and use them for measurement series or further analysis.
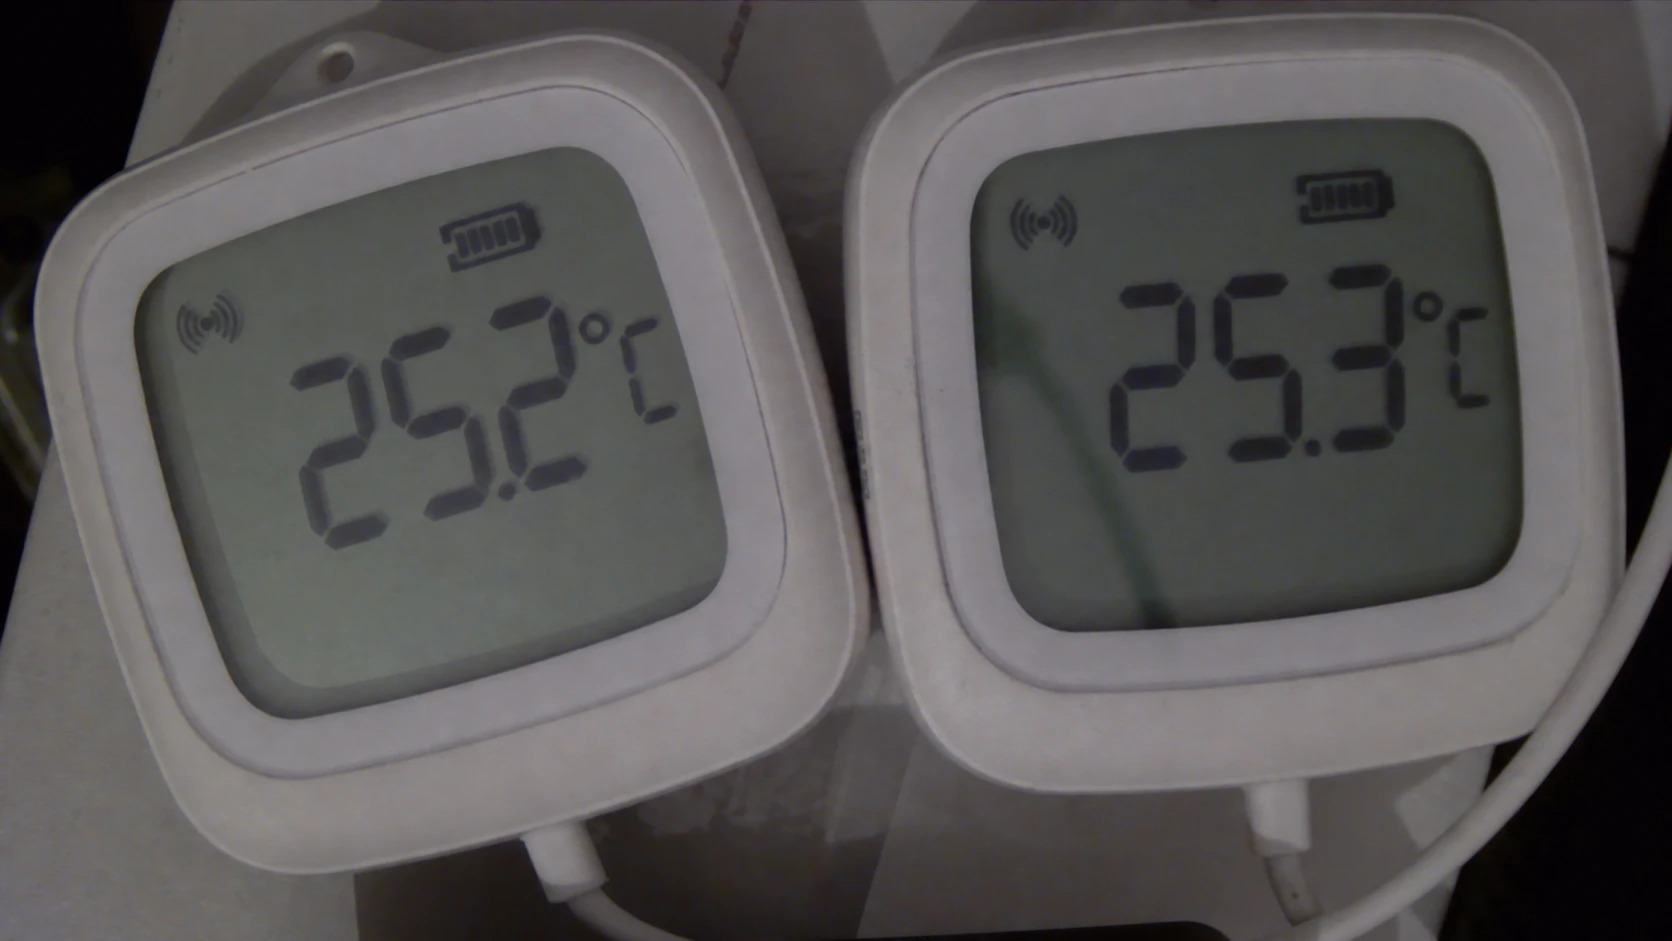 Temperature
Read digital temperature displays and document temperature curves over longer periods.
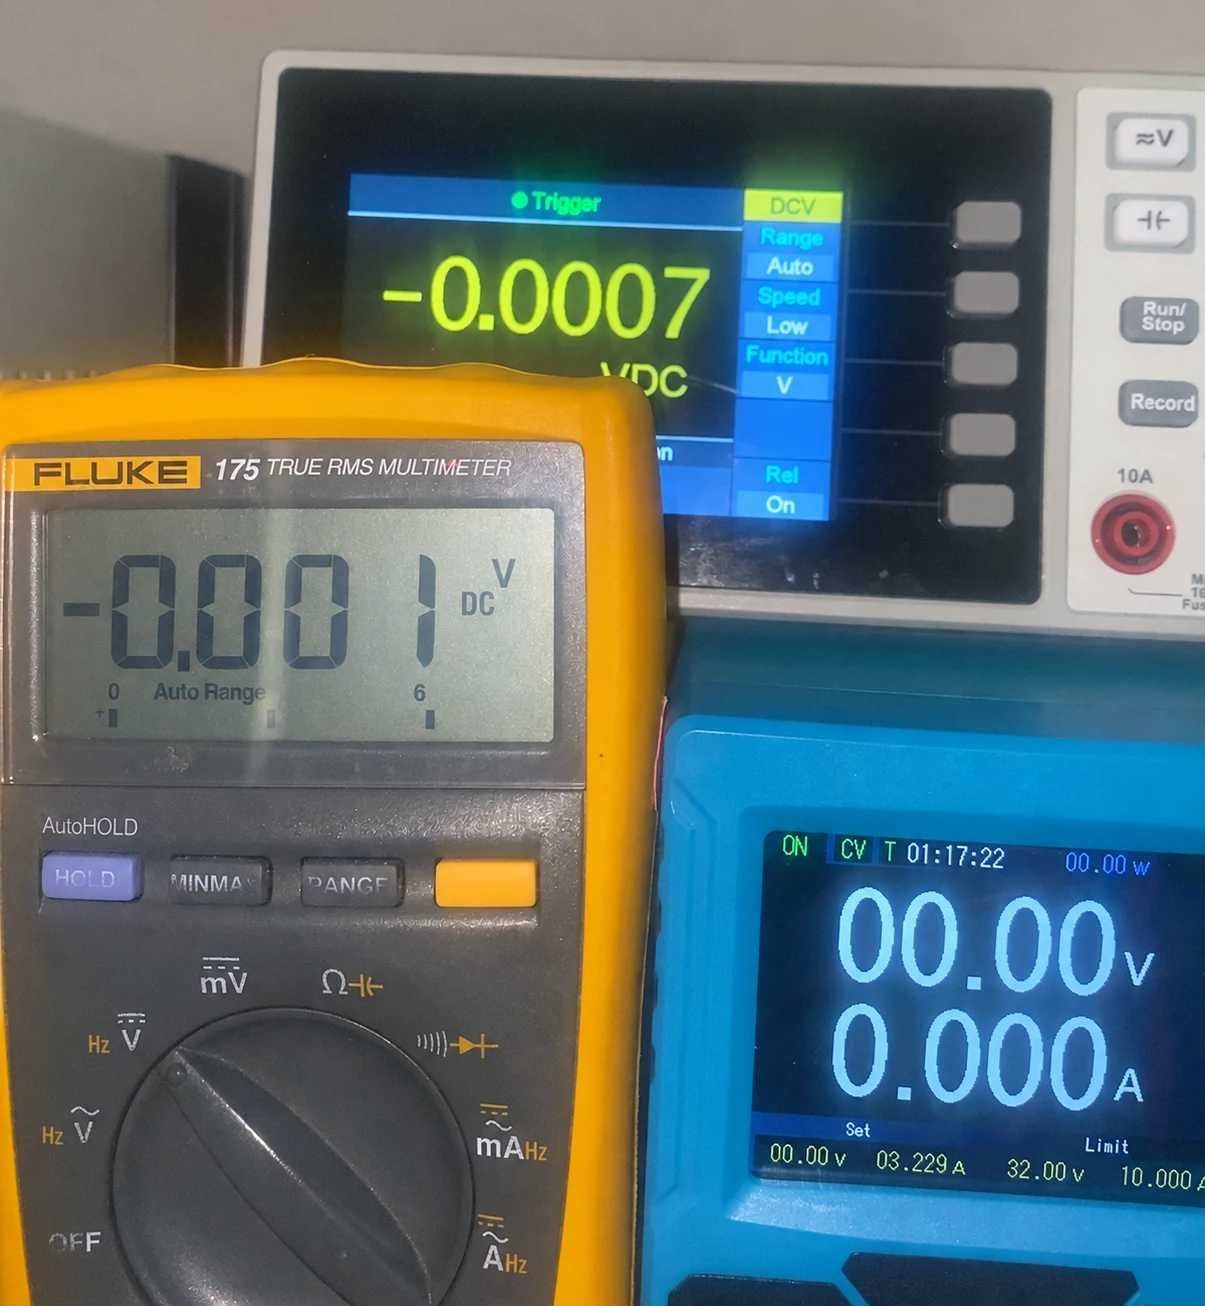 Device variety
Handheld multimeter, bench multimeter and power supply: process different devices and display technologies.
08 / MORE FROM ONE READING
Several values can be captured from a single display. Displayreader reads the different display areas and provides their values separately for further processing.
The example shows two rows of digits on one device: one camera image, two captured values.
010209 / QUICKLY ALIGNED
The camera does not have to be positioned to the millimetre. Point it at the display and choose the image section so that all the digits you need are sharp and fully visible.
A view as frontal as possible, sufficiently large digits and even lighting create good conditions. Steep angles, reflections and obscured display areas should be avoided.
Display fully in the image
Digits sharp and easy to read
Steady position, no reflections
10 / INTEGRATE INTO YOUR OWN APPLICATIONS
Control Displayreader from your own applications using interface commands. Over the network you can, for example, request a value with READ? and process it directly afterwards.
That turns an instrument without its own PC interface into a data source for your application – the camera does the reading.
Send request → receive value11 / STRAIGHT FROM THE CALIBRATION PROCEDURE
Retrieve display values directly from a calibration procedure: integration is straightforward via the VISA FSC and the Read? command. Displayreader reads the display with a webcam and returns the value to MET/CAL.
The practical video shows a Fluke 175 at three measurement points: 2.4 V, 2.8 V and 3.2 V. A 5101B serves as the calibrator. Four display photos are read per measurement point, giving four values.
At the bottom right of the video you can see Displayreader with the webcam view of the Fluke 175 – and follow directly how display photos become values for the procedure.
Discuss MET/CAL integration12 / DOCUMENT VALUES TRACEABLY
Objective evidence for every measurement result.
A stored display photo can add a vivid record of the original reading to the documented value.
Section 7.5 “Technical records” requires traceable technical records: original observations, data and calculations, plus information that allows a repetition as comparable as possible. Amendments must be traceable to previous versions; the original and the amendment are to be retained with the date and the responsible person.
A photo supports this documentation. The standard does not generally prescribe display photos; they do not replace the other required records or properly managed data storage.
Standard context: A2LA on section 7.513 / WHEREVER DISPLAYS SHOW VALUES
Read existing instruments automatically – in the laboratory, in development and in everyday industrial work.
GOOD TO KNOW
Here you will find the most important answers about Displayreader.
Ask us personallyNo. The camera captures the reading optically. The instrument itself needs neither USB nor any other data interface to the PC.
Yes. A good, modern, off-the-shelf webcam on a tripod is sufficient. For reliable capture the digits should be sharp, large enough and as free of reflections as possible in the image.
Yes. Displayreader is designed for series values and long-term measurements. The values are recorded with a time stamp and can then be analysed statistically or shown as a chart.
You can transfer your values into Excel for analysis and create charts. A MET/CAL connection makes it possible to take the values read into calibration procedures. We will discuss the right integration based on your workflow.
Test series carried out reached 100,000 readings without an error. This requires correct use and optimal conditions: a clean, clearly legible display without disruptive reflections and a sharp camera image. These results refer to the stated test conditions. The measurement accuracy of the instrument itself remains unchanged.
No. Displayreader can run entirely locally on your laboratory PC. The data stays with you. An optional network connection allows control from your own applications.
Yes. Several display areas on one display can be captured separately and their values processed further.
No. Besides calibration laboratories, quality assurance, production, development and test benches benefit too – wherever display values are regularly transferred by hand.
That is best checked with your specific instrument. Tell us the device type and, if you like, send a photo of the display via the contact form. Together we will clarify how Displayreader fits into your workflow.
THE NEXT VALUE DOES NOT HAVE TO BE TYPED.
Show us your instrument. Together we will find out
how Displayreader makes your working day easier.